Earth Science Associates developed four models for forecasts of bids in future sales. The first estimates the probability of at least one bid on deep water blocks. Block characteristics, from water depth to proximity of relinquished leases, to the history of past bids, have all been tabulated and are updated daily as changes occur. Additionally, there are global variables (e.g., oil price) and company-specific variables (e.g., how far is the nearest lease owned by ENI?). In all, we evaluated two dozen variables.
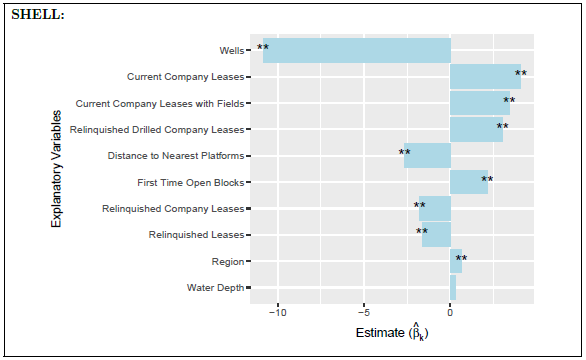
For the 20 companies that dominate deep water, we calculate the marginal positive and negative preferences toward these block characteristics, as seen below.

The tornado plot identifies the explanatory variables (listed along the y-axis) shown to be statistically significant in estimation of bid likelihood for Shell in the spring 2018 sale. A positive estimate results in an increase of probability of bidding and a negative estimate decreases the probability of bidding.
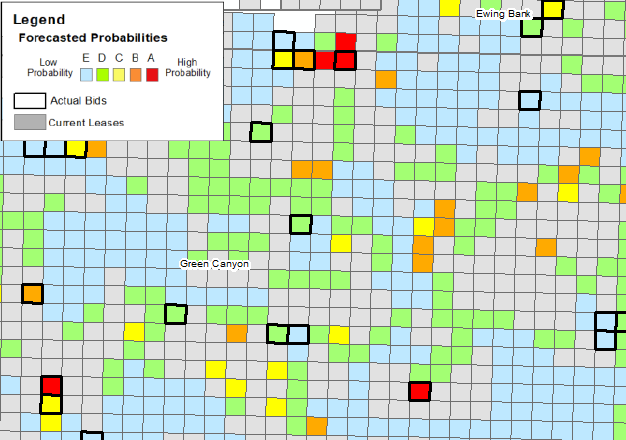
Some companies are less likely to bid in deeper waters, others systematically stay close to their existing leases. The company-level analyses of each block are then combined to esti-mate the probability that each block will receive at least one bid. We call this the Bid/No-Bid model. It is estimated using logistic regressions.

A map of estimated probability of at least one bid in the Spring 2018 sale, focused on northern Green Canyon. Current Leases are shown in grey, ESA’s pre-sale probabilities of bids are shown in the legend colors and those blocks actually bid are surrounded by thick, black outlines.
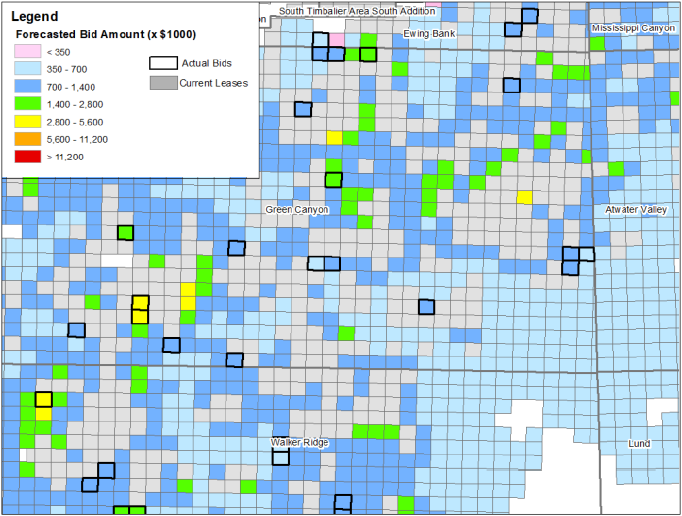
The second model, shown below, forecasts the amount of the high bid in deep water blocks. Like the Bid/No-Bid model, empirical block characteristics and companies’ historically evidenced preferences are included in the Bid Amount model. This model is estimated with a multivariate linear regression of past bids.
These regression models train over specific periods, which the user controls. Any period since 2009 of at least three years can be used to train the models to forecast for 2013 through the upcoming sale. For the historical sales (from 2013 on), forecasts can be made to compare the forecasted probability of Bid and Bid Amount with what actually occurred in the sale.

A map of the forecasted high bid amount in the spring 2018 sale, focused on northern Green Canyon. ESA’s estimated bid amounts are shown in the legend colors.
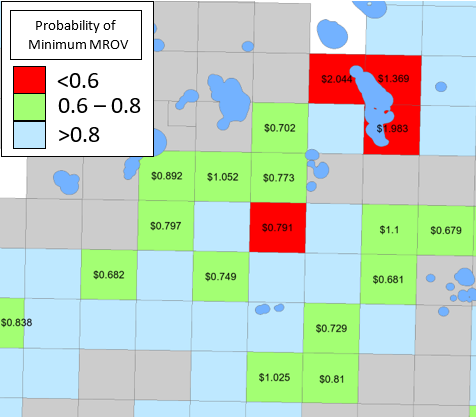
While competitor analysis is extremely important, your bid must also be accepted by the government which is primarily determined by the MROV (Mean Range of Values). The MROV is the government’s estimated present value of the lease and will reject bids less than the MROV. The third model in the GOM3 bidding analytics estimates the likelihood that a block will receive a minimum MROV is forecast. Finally, in the final model an estimated MROV dollar amount is calculated for the blocks that are not likely to receive minimum MROVs from the government.
The MROV forecasts are made using random forest models. The training variables are similar to the bid amount variables but also include past MROV data as this influences the government’s MROV calculation. These forecasts provide insight on how to better avoid rejections by the government.

A map of the minimum MROV likelihood and labeled with the estimated MROV in millions of dollars for those that are not likely minimum MROVs.
These models provide systematic analysis of bidding behavior and an objective set of updated benchmarks, on constantly updated information, to analyze your competitors and examine the relative attractiveness of regions and blocks within them. Through the power of GOM3, model results can be combined with the other data and tools and, more importantly, with your company’s proprietary geoscience, engineering and scouting information – as well as a company strategy.
Why ponder a big, static war-room wall map when you can use state-of-the-art models based on data refreshed daily?


