

The 10th Annual User Conference will be held on Thursday, November 5, 2015 at Anadarko's offices in The Woodlands (Register here). As always, this event will present enhancements from the past year, particularly the launch of GOMsmart 2.0 - please keep that in mind if your focus is GOMsmart and not just ArcGIS. We will also detail improvements and modifications to the ArcGIS tools, new data that has been added in the last year and a look at future plans.

The conference is intended for geologists, geophysicists, engineers, land specialists, GIS professionals/techs, and managers. The exchange of ideas and directions for our future development are still the top priority of the conference; we will continue to aim for the informality and small size of past years. Registration is free, though limited, but we will do our best to accommodate all who wish to attend.
Agenda
To attend the conference, please click here to register. We look forward to seeing you there.
Storms Data in GOMsmart 2.0
ESA has been working on integrating hurricane information from the National Hurricane Center (NHC) directly into GOMsmart and GOM3. This data can be accessed by clicking on the Storms tab in GOMsmart or by going to "What's New" in GOM3 (the red exclamation point).
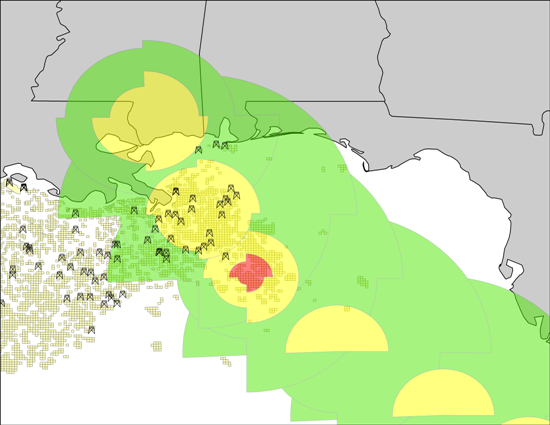
The Storms tab in GOMsmart will always display the current disturbances, forecast track and wind radii in the Atlantic Basin. The NHC typically updates this information four times a day and we gather the data, process it, perform further analysis and update our map accordingly.
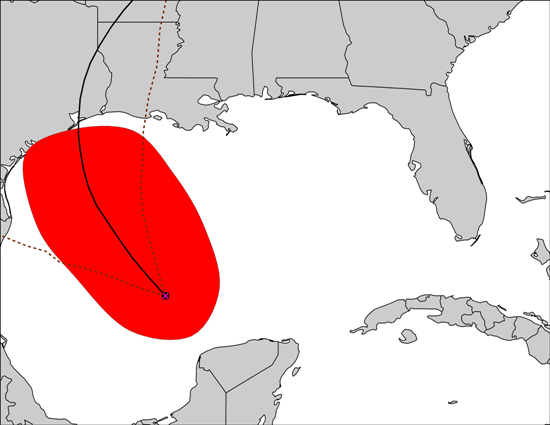
Disturbances are weather systems that have a chance of forming into a cyclone sometime over the next five days. The NHC gives the current position of the disturbance and the predicted area where the distubance will form into a cyclone. ESA gathers these data and, using an algorithm we designed, makes a forecast on the future track if the system forms into a cyclone. This forecast is made much earlier than the NHC's forecast and is designed as an early warning system.
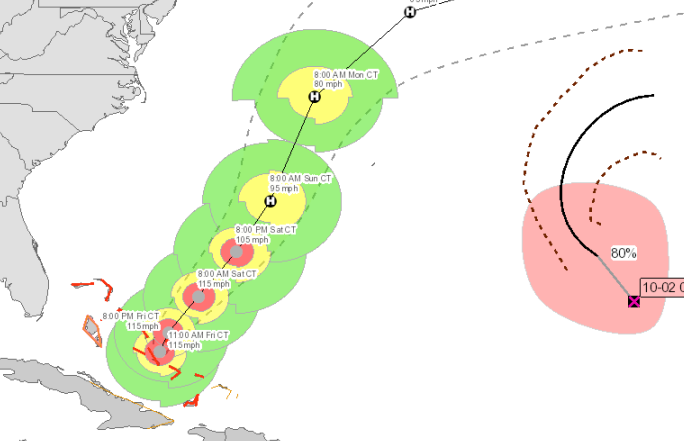
The forecast track is the estimated path of the cyclone directly from the NHC. The forecast track gives the best estimate for the center of the cyclone and is accompanied by a cone to represent the uncertainty in the NHC forecast. The track is labeled based on the intensity of the cyclone: D for tropical depression (less than 34 kt winds), S for tropical storm (between 34 and 64 kt winds) and H for hurricane (more than 64 kt winds).
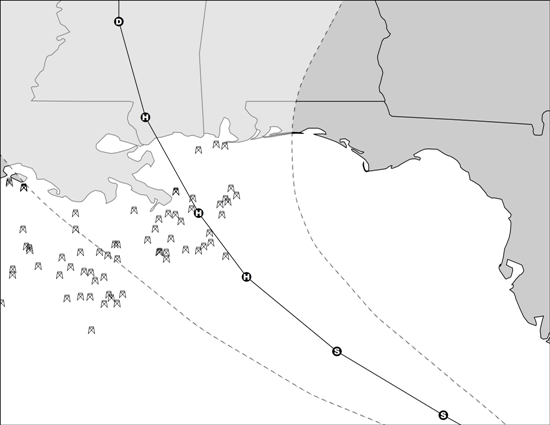
The wind radii are released in text format and converted to shapes by ESA. The wind radii give the distance from the center of the cyclone in quadrants of 34/50/64 knot wind speeds. ESA uses the information from the wind radii to plot wind speeds over time at each and every platform. This can be accessed by clicking on a platform in the map and chooing the Wind Speed Forecast option (coming soon to the ArcGIS hotlink tool).
More information on using the Storm Forecast information can be found within GOMsmart's Help system here.