


Like all other aspects of GOM3, enhancements to the Business Planning Add-on are continuous. In the summer, forecasts of the BOEM's MROV/ADV amounts were added, using random forests to forecast the likelihood that the government would accept the minimum required bid and how much would be required if their number was higher.
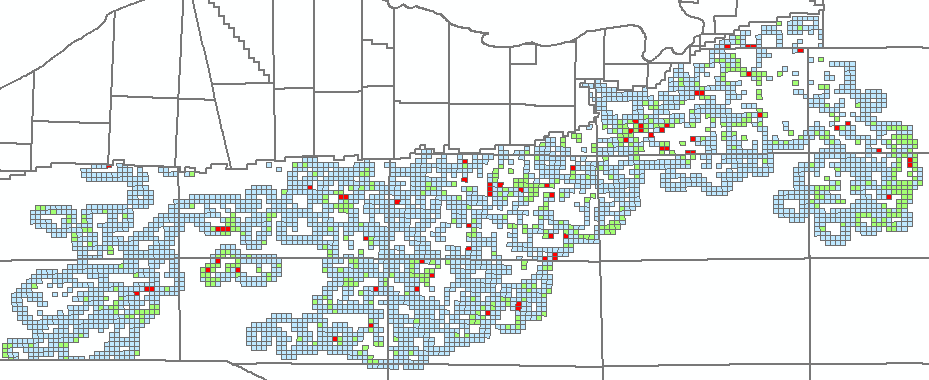 Likelihood that the BOEM will accept a minimum bid (red blocks are least likely).
Since the last sale, a number of modifications to the prediction models and displays have been integrated to improve the accuracy and display of the results. Further analysis showed 95% of bids in the last 10 years have been within roughly 10 miles of active leases, so limiting our training and forecast areas has greatly increased the accuracy of a block receiving a bid. New variables were added to the model, including rejected bids and losing bids, and swapping out the density of Fields for the average Fields' Estimated Ultimate Recovery. The model was also enhanced by further decorrelating other variables. It should also be mentioned that, for those who want to see an evaluation of currently leased blocks with the same methodology, the output now includes a second set of data to estimate bid likelihood and estimated high bids for those blocks that are currently leased.
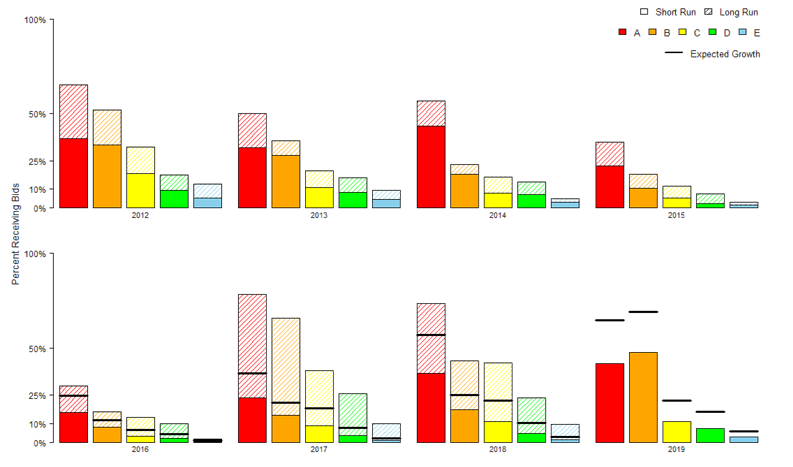 Accuracy of old model bid forecasts, by cohort, in the first year (solid) and subsequent three years (hatched). The old model ends in March, 2019.
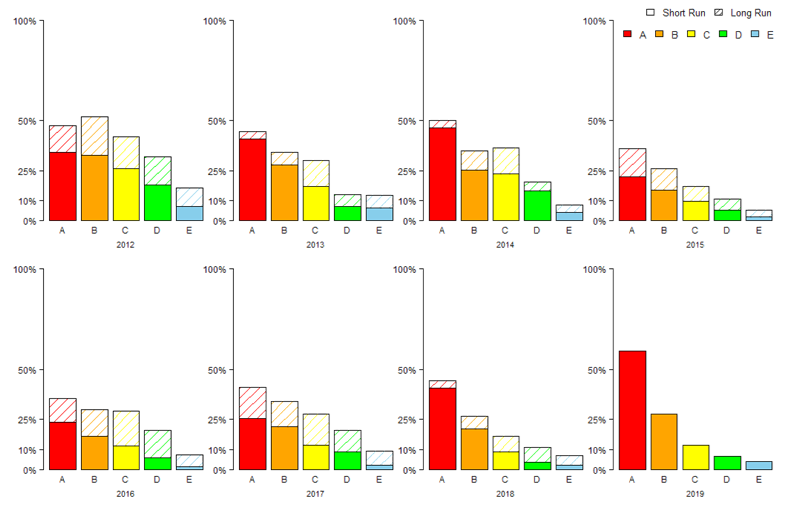 Accuracy of new model bid forecasts, by cohort, in the first year (solid) and subsequent three years (hatched).
One important item missing from the graphs above is the number of blocks in each cohort. The older model used fix cutoffs in bid likelihood, so while some of the predictions are quite high, they also only had a few blocks. The new model now sets the cohorts by the percentage of cumulative probability of all blocks to receive a bid. This is important to ensure that the output can reliably highlight the most attractive blocks to all companies, then the next most attractive, and so on. The old model presented data similarly, but was prone to highlight too few blocks that might be worth watching for more competition.
As shown above, accuracy has increased in the hindcasts for the last eight years, and significantly so for predictions of the sale in that year. The older model was good at predicting attractive blocks, but the newer model has increased accuracy in a shorter time frame.
The graphs also show accuracy decreasing when the price of oil dropped precipitously, as expected as so many fewer blocks received bids in those years. The newer model is doing a better job of not only predicting which blocks will be bid, but also of estimating the number of blocks receiving bids for the entire sale.
Some portions of ArcGIS can be challenging when customizing maps. Maps can convey a lot of information at a glance and one of the ways this is done is with labels. Like other parts of ArcGIS, there are a large number of options that can be used to customize labels to the nth degree.
This webinar will go over some of the options that are most often used within Earth Science Associates to make labels helpful and legible. We will detail some of the limitations within the different options and some ways to overcome them. Most importantly, the webinar will detail the Label Expression Library to show the list of complicated label expressions accessible with a couple of clicks. This webinar will not go over annotation work, which gets very specific to the map (which can vary by user/company).
The webinar will be held Wednesday, Nov. 13th. Click here to register.
Color changes, even differences smaller than these, are enough to discern different types of features.