

Shazam is a new machine learning tool from Earth Science Associates. It is designed to identify potential, unproduced pays by training on all the digital well logs available in the Gulf of Mexico. Based on the curve signatures from producing completions, it identifies new opportunities in the 98% of wells that are outside completed zones. It is a novel approach, using neural networks to high-grade targets from tens of millions of feet of logged wells. This allows geologists and petrophysicists to focus on the most important parts of each log. After these prospective intervals are identified, we estimate risked ultimate recoveries based on local analogous completions. Shazam has located hundreds of prospective intervals in over 5,000 wells.
 Two possible pays (in orange) identified in a Miocene zone, though unfortunately below an existing completion (in blue).
The example above illustrates the output from the Shazam models. The log in the first track displays the probability of pay, from 0 to 100%. The blue highlighted zone in the shallow zone marks where the completion was set. Unsurprisingly, the Shazam-estimated probability of pay was high. Below that, highlighted in orange, are two other zones which also have a high probability of pay. A minimum of ten feet of continuous high scores is required to be marked as a pay.
The rest of the first track has generally very low probability scores. Interestingly, in the far right 'context' track (a feature of GOMsmart's well log viewer), the operator of this well had also marked the same two zones identified by Shazam as hydrocarbon bearing zones (the small blue sections in the middle of the far right track). While validating the prediction, these hydrocarbon bearing zones are not inputs to Shazam.
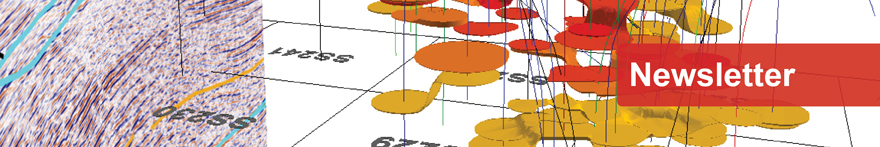
 Wells with Shazam analysis. Red indicates the 3-curve model: depth, gamma ray and resistivity curves. Green adds neutron and bulk density curves (the 5-curve model). Purple adds methane, ethane, propane and lithology (the most information-rich analysis, our 10-curve model).
Shazam uses Multilayer Perceptron models and Transformer models (the 'T' in ChatGPT) together in a final ensemble model to calculate its probabilities. Accuracy varies by the number of curves available within each section of the log and the risked EURs are calculated based on that accuracy. As mentioned above, the first Multilayer Perceptron model uses MD with gamma ray and resistivity curves. The second adds neutron and bulk density curves. The third adds methane, ethane, propane and lithology. The transformer model also includes location, reservoir age and salt.
The map above is available for everyone to see which wells have Shazam data from the digital logs. It is in the new Shazam tab within GOMsmart. A second interactive map displays each pay by the risked estimated ultimate recovery of the pay and available only to those subscribing to Shazam.
Although the analysis identified thousands of small targets, hundreds have risked EUR greater than a million barrels – with some as large as tens of millions of BOE. Larger candidate pays may be developed quickly, at lower cost and with less risk than typical targets. The output can be helpful when calculating the full portfolio of a company, assessing abandonment and decommissioning strategies or saving time when evaluating new acquisitions. This methodology is applicable to plays and basins around the world.