

The Smart Tiff Viewer is a new web application to display and work with image well logs within a web browser. It is available as part of GOMsmart and GOM3 to all users. It displays image logs for publicly released well logs or your own logs and features tools to calibrate the curves, annotate, digitize, add more data (paleo, completions, LAS), and OCR the text.
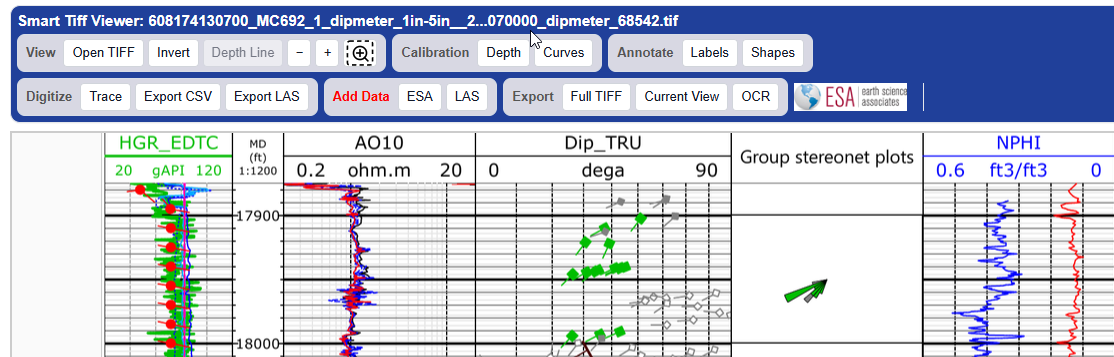 The controls of the Smart Tiff Viewer.
The first controls are simply for opening a Tiff file or zooming, but the next step is to calibrate the depth and curve values. The top depth is entered into the form, then clicking on the image where that depth appears, followed by repeating this for the bottom depth. Similarly for each curve, the values are entered for the left and right side of the curve and clicking on the left and right side of each track to define the extent.
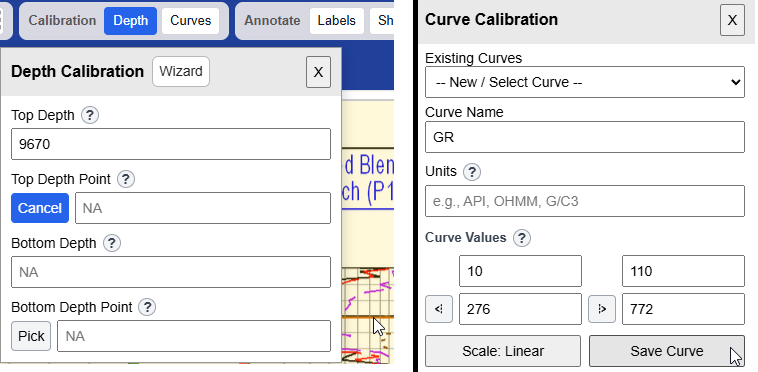 Depth calibration on the left and curve calibration on the right.
Both labels and a variety of shapes can be added to the log, all customizable by size and color. Shapes include rectangles, circles, polygons, arrows, lines and fixed horizontal lines.
Once the calibration is set, curves can be digitized. The autotrace button attempts to follow a line that is chosen by clicking on the image. The freeform button is used to click on each point of the line manually (or by holding down the mouse button while freely following the line). The Curve Detail specifies the number of points (density) to create - it can be increased to more than 100.
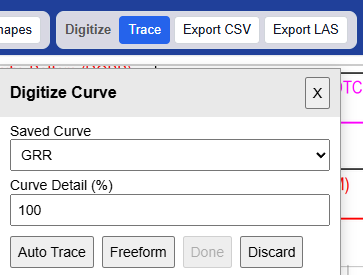 Setting up digitization.
One of the most unique features is the ability to integrate completion intervals and paleo data from the ESA database into the display. Once the depth is calibrated, the ESA button in the Add Data section can be used to load paleo picks as red circles and comps as blue intervals. They are editable with the Shapes button but the depths are fixed in the right location.
In addition, the curves from LAS files can also be loaded to make the display even richer.
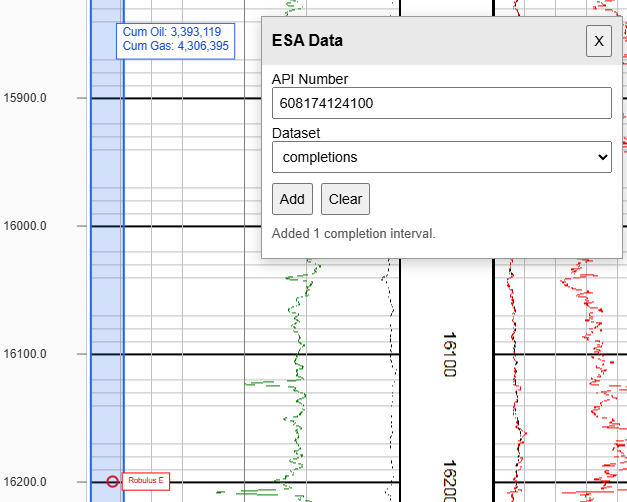 A completion interval and paleo observation in the SS3 well of MC503.
The full tiff or the current view can be exported to a new image, which will include the annotation or extra data added to the log. But also available to export is an OCR of the text within the image. After clicking the Pick OCR Region button, a box is drawn around the text to OCR, along with a choice between text written verically or horizontally. The text will be previewed in the window after clicking Run OCR. That text can also be exported to a text file, if needed.
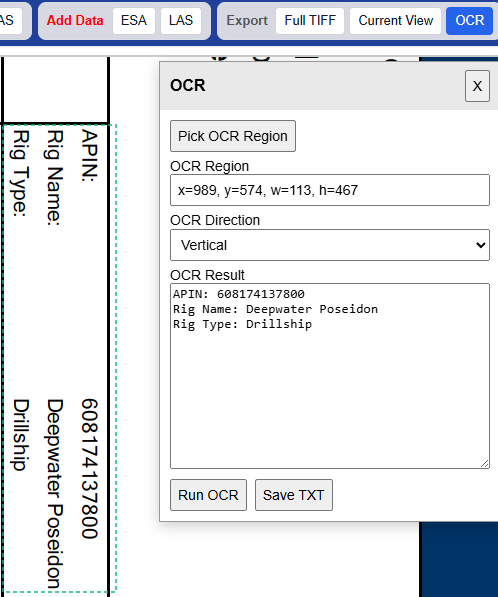 The OCR form to read text from the well log image.