


AskSmart now has the ability to create a wide variety of graphs, far beyond the pre-made options previously available in GOMsmart. In fact, not only can data be used to create new charts, but they are also linked to tables and maps interactively. Most importantly, these are the first GOMsmart charts that can incorporate multiple features at once.
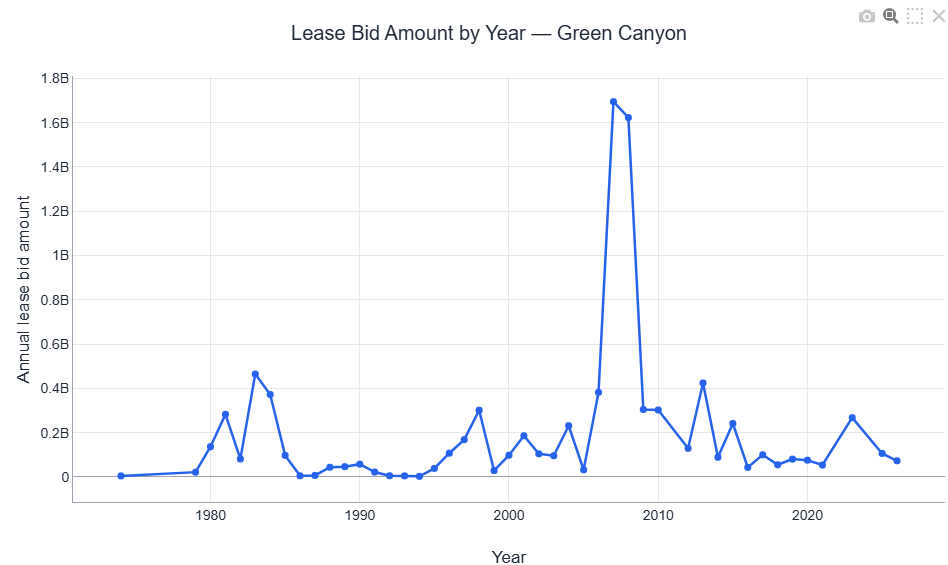
For example, it could be as simple as prompting "make a chart of annual lease bids in Green Canyon":
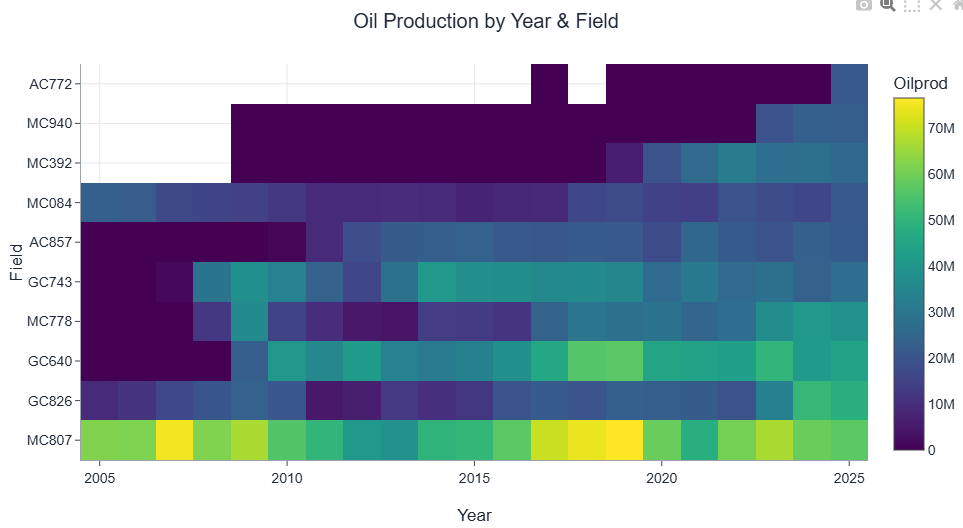
To something more complicated, such as making "a heatmap of yearly oil production from 2005 through 2025 for the top 10 fields by oil production in 2025."
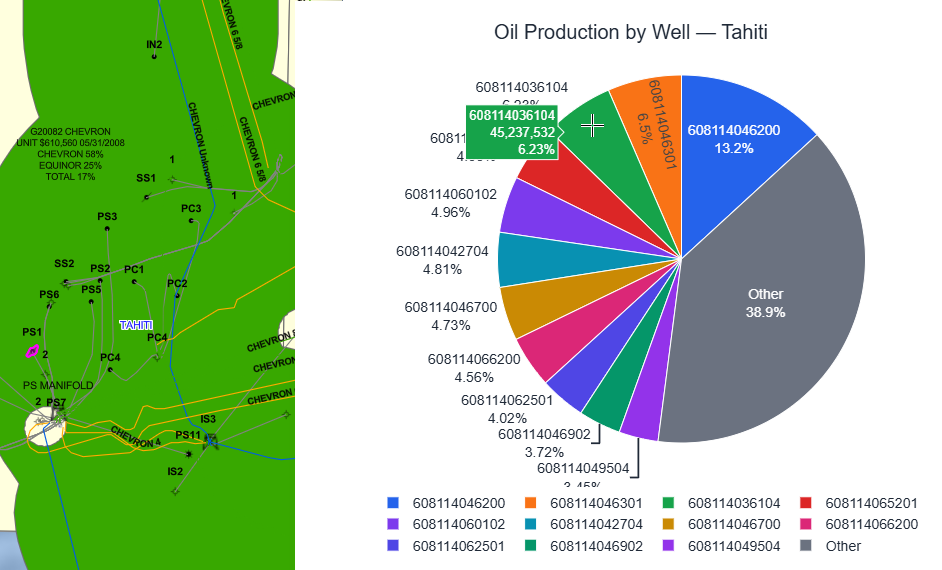
And in this example, with a prompt of "make a pie chart of oil production for each well in the Tahiti field", by moving the cursor over each slice of the pie, the well is highlighted in pink on the map:
All in all, AskSmart can now create line charts, bar charts, histograms, box plots, scatter plots, heat maps and pie charts.
By request, AskSmart has extended to a higher level of analysis when working through GOMsmart data. This means that prompting AskSmart to do analysis on the data leads to rich summaries of information that would often be tedious to gather and build. In this example, I was actually making a table first with this prompt: "make a table of Shell's wells in the last 10 years including spud date, TD date, status and production." Many times that is enough, but in this case I took it further just for an overall summary with this prompt: "what are the average drill times, completion rates and how many produced?"
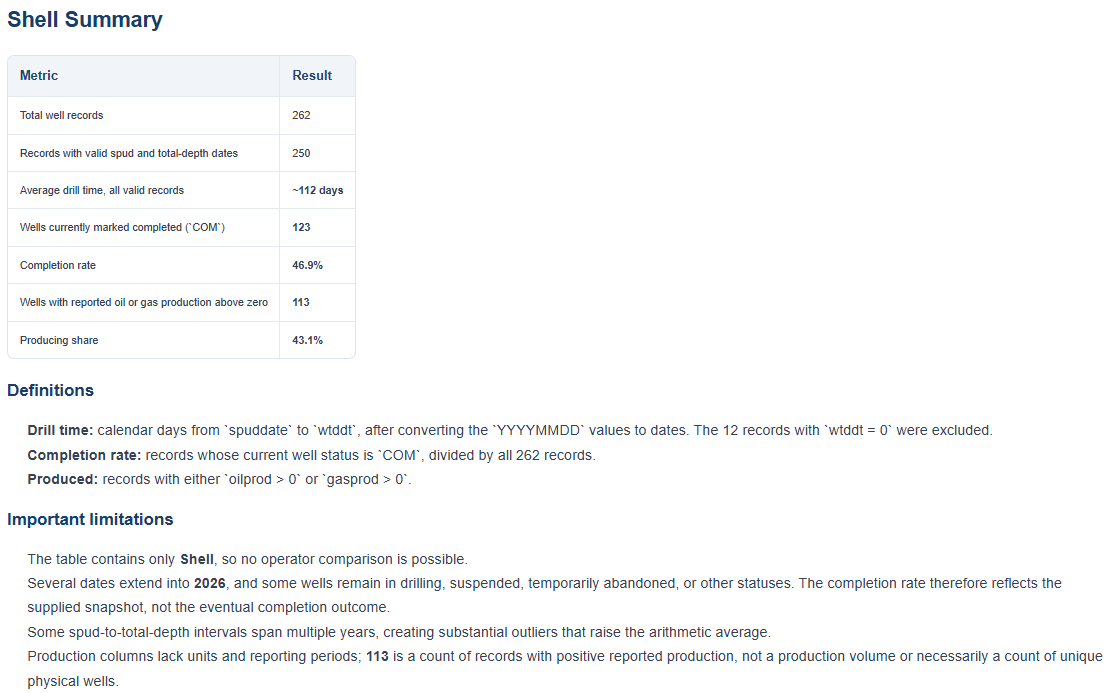
This one is simple (and fits well in the newsletter) but there are some important notes that are generated, including information on how the drilling times were calculated, what was omitted due to data limitations and how it determined the ratio of wells that were completed.
The analysis can lead to a variety of insights, often unexpected. A couple of examples include "analyze bids from Chevron over the last 10 years" or "analyze the annual production of Who Dat and Tahiti." We encourage you to explore what's possible with these types of questions and send us your feedback.