Smart Profiler — Gulf of Mexico analytics
✓ Historical field comparisons✓ Interactive mapping✓ Offshore activity trends✓ Lease sale intelligence
Offshore intelligence

Explore perspectives on the Gulf of Mexico.

The Smart Profiler brings offshore field analogs, decommissioning analysis, drilling activity, and lease bidding history together in interactive maps, charts, and tables—helping you turn historical activity into better-informed decisions.

Smart Profiler analytical dashboards

Five ways to analyze the Gulf of Mexico.

Choose the analysis that fits your question. Each dashboard offers focused visual tools for exploring historical patterns and comparing opportunities.

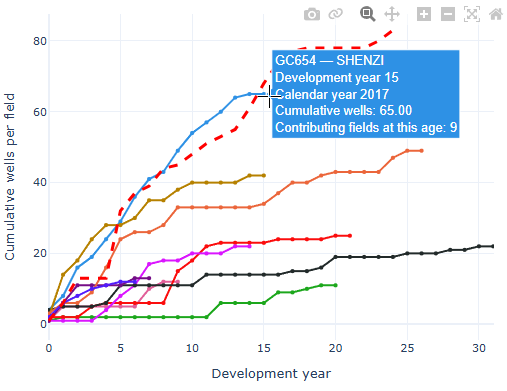
Field analog chart comparing cumulative wells per field by development yearView full-size chart ↗
01 / ANALOG FIELD DEVELOPMENT

Compare offshore field development.

Compare a selected field or prospective project with historical analog fields. Examine development schedules, well counts, permits, and cumulative oil and gas production using interactive charts and maps.

Explore Field Analogs →
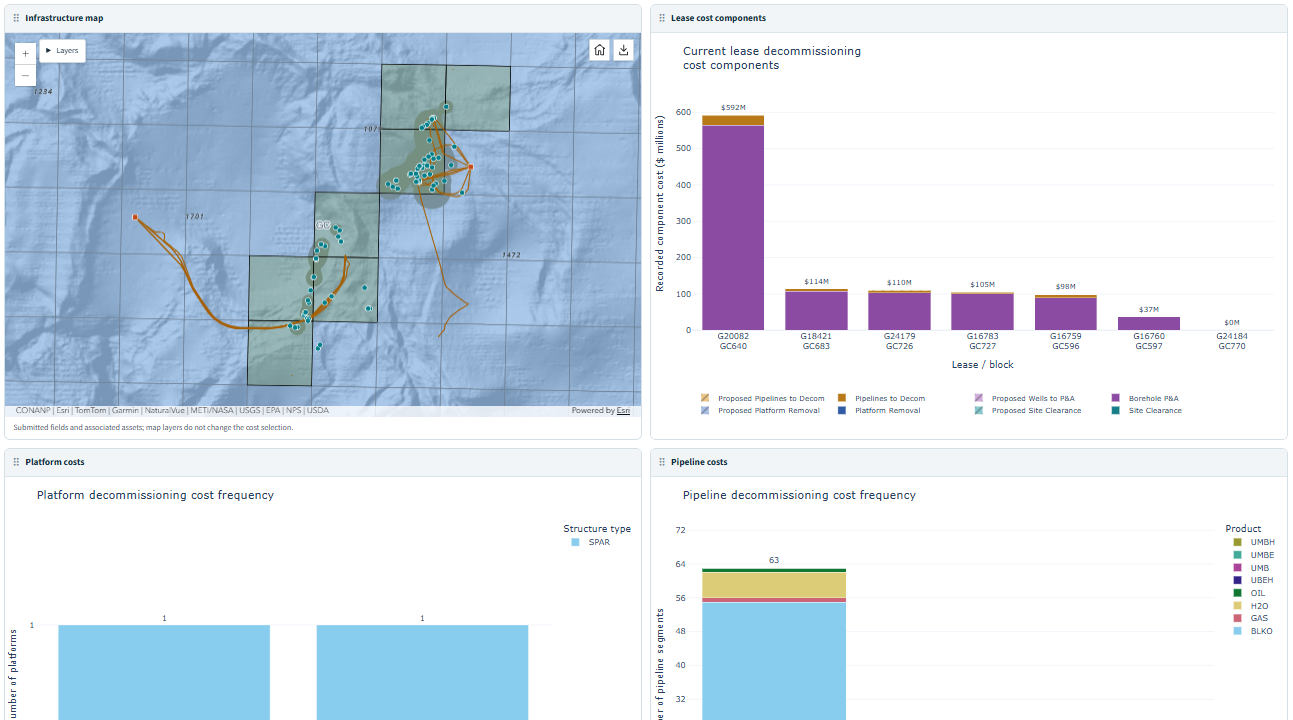
Decommissioning dashboard showing an offshore infrastructure map, lease cost components, and platform and pipeline cost chartsView full-size dashboard ↗
02 / DECOMMISSIONING

Evaluate field decommissioning costs.

Explore estimated decommissioning costs for a selected offshore field. Review the potential financial scale of well plugging, facility removal, and other end-of-life obligations when evaluating mature assets.

Explore Decommissioning →
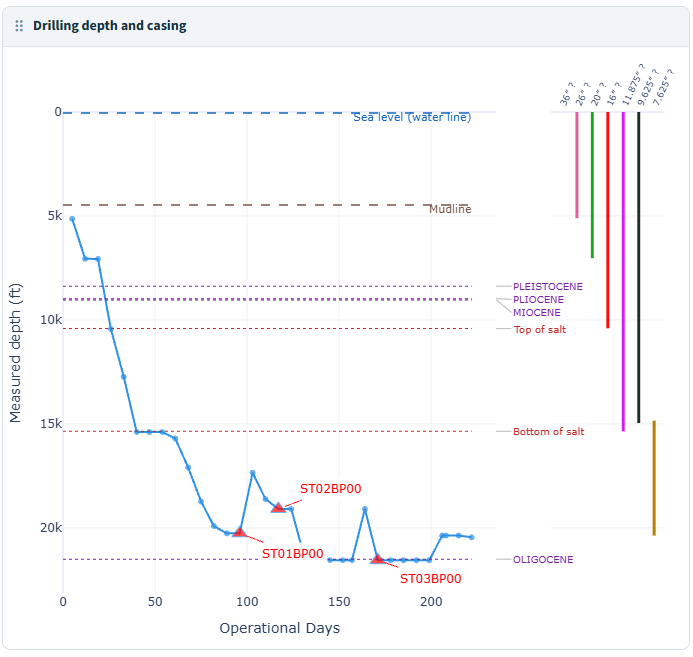
Drilling depth and casing chart showing measured depth over operational days, geological horizons, sidetracks, and casing sizesView full-size chart ↗
03 / DRILLING

Analyze drilling rates and activity.

Investigate well drilling rates within a selected geographic area. Use time-series charts and supporting information to recognize changes in drilling pace, bypasses and sidetracks, casing and mud weights.

Explore Drilling →
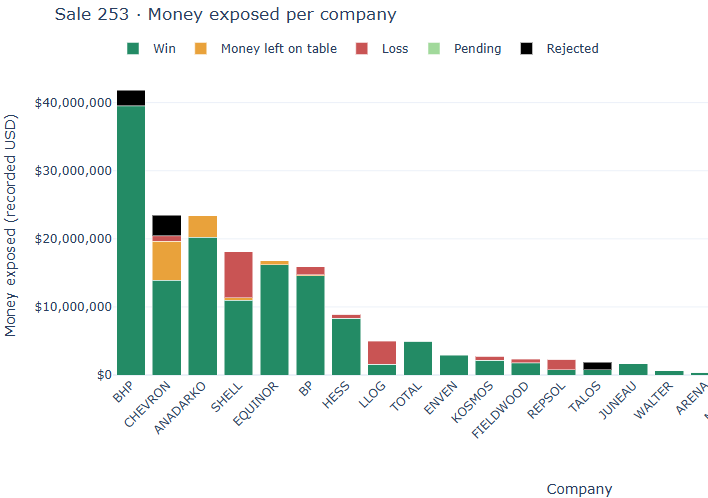
Sale 253 stacked bar chart comparing money exposed per company across winning, money left on the table, loss, pending, and rejected bidsView full-size chart ↗
04 / BIDDING — SALE ANALYSIS

Investigate individual lease sales.

Explore offshore lease bidding within a selected Gulf of Mexico sale. Visualize bid distributions, competition, and bidding patterns through coordinated graphs, maps, and tables.

Explore Sale Analysis →
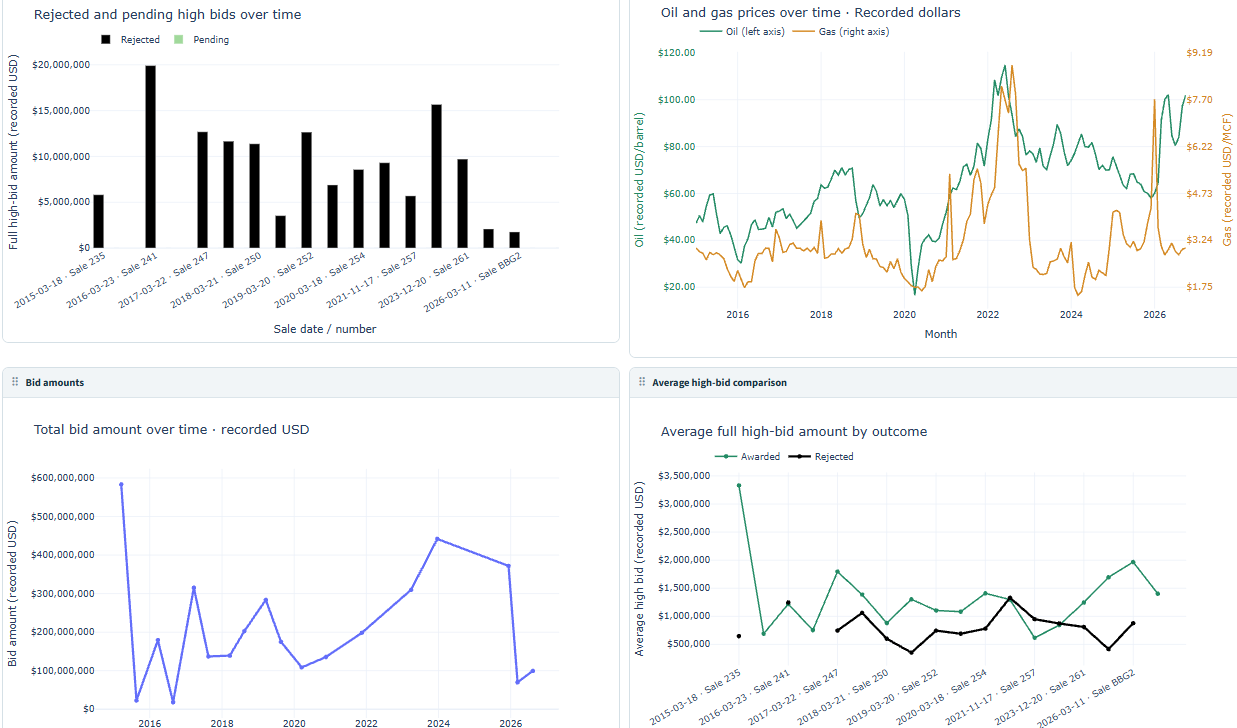
Historical bidding dashboard showing rejected and pending high bids, oil and gas prices, total bid amounts, and average high bids by outcome over timeView full-size dashboard ↗
05 / BIDDING — OVER TIME

Track historical bidding trends.

Compare offshore lease bidding across successive Gulf of Mexico sales. Explore changes in participation, bid activity, and market interest to place current bidding behavior in context.

Explore Bidding Trends →
See the Smart Profiler in action

Turn offshore data into a clearer picture.

Contact Earth Science Associates to learn more about the Smart Profiler, see a demonstration, or discuss access to its analytical dashboards.

Contact ESA