
Load bidding history
- Open Bidding - over time in the application sidebar.
- Set First sale year and Last sale year. The first must be no later than the last.
- Optionally choose Companies to compare. Company lines apply only to Bid amounts; rejection and price panels keep their full submitted scope.
- Click Analyze bidding to refresh bid amounts, high-bid outcomes and price histories for the selected years.
- Expand Over time chart controls above the workspace to change grouping, measures, rank scope or dollar basis.
Changing years clears all Over Time results. Changing companies clears Bid amounts only. Click Analyze bidding after input changes; display controls reuse the submitted snapshot.
Choose grouping, measures and dollars
| Control | What it changes |
|---|---|
| Time grouping | By sale keeps recorded sale/date identities separate. Calendar year combines sales into yearly summaries. Applies to Bid amounts and both high-bid outcome charts; prices stay monthly. |
| Bid measure | Choose Total bid amount, Average bid amount or Maximum bid amount. Maximum means the largest individual bid, or one company’s allocation to an individual bid. |
| Bid scope | Choose All submitted bids or High bids only (recorded rank 1). High rank does not by itself prove acceptance. |
| Rejection measure | Choose Total amount, Bid count or Rejection rate for the rejected/pending panel. |
| Normalize prices by GDP | Rebases available Over Time dollar values using submitted monthly GDP factors and a common reference month. Counts, rates and classifications are unchanged. |
GDP adjustment uses the current month’s usable factor or the latest usable month before it, independent of the selected years. The display identifies the actual reference. Bid dollars are adjusted by sale month before yearly aggregation. Missing factors leave affected dollar totals or means unknown, including incomplete annual aggregates.
Read the four chart panels
| Panel | How to interpret it |
|---|---|
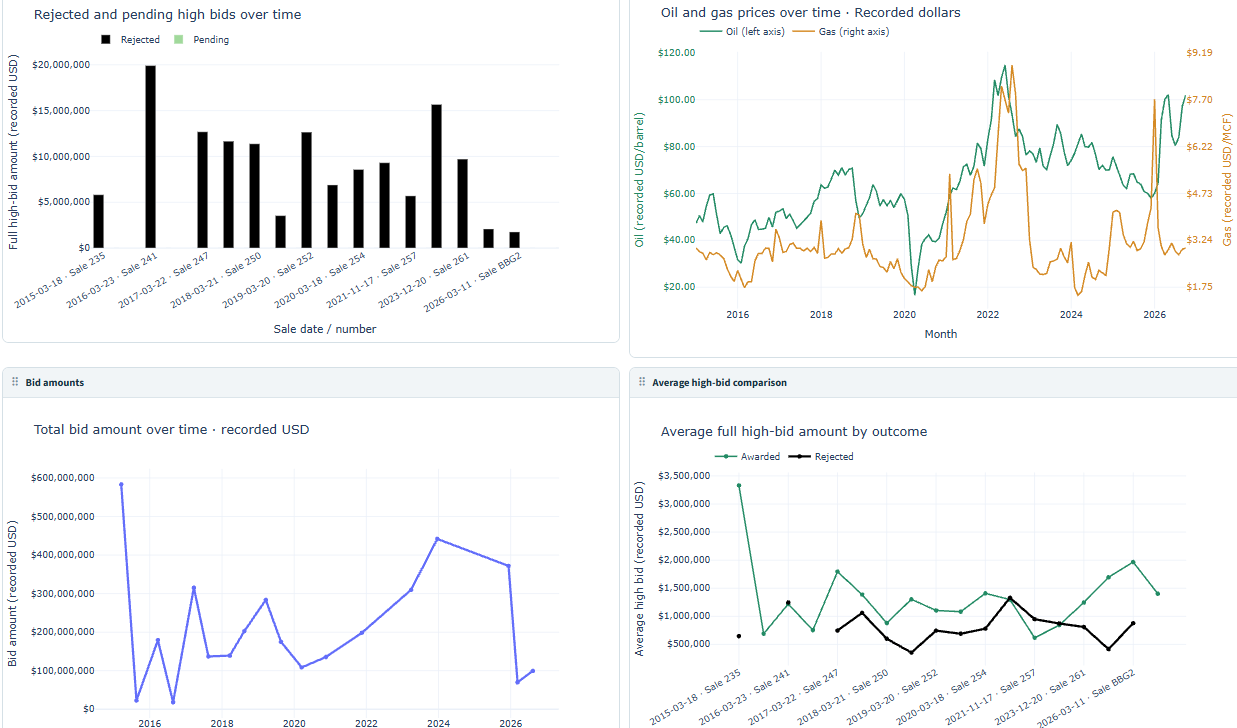
| Bid amounts | All companies counts each full joint bid once. Company lines use recorded percentage allocations; company counts describe participation and cannot be added to obtain the market count. Annual averages use summed dollars divided by summed counts, not an average of sale averages. Maximum hovers identify the block or tied blocks. |
| Rejected and pending high bids | Uses full rank-1 bids, counting each joint bid once. Rejected is black and Pending light green. Rejection rate is Rejected ÷ (Won + Rejected) × 100; pending bids are excluded from its denominator. |
| Average high-bid comparison | Compares average full high bids by Awarded and Rejected outcome, with Pending observations when present. Missing category averages remain unavailable. Lower-ranked losses do not enter these averages. |
| Oil and gas prices | Monthly oil is green on the left USD/barrel axis; gas is orange on the right USD/MCF axis. The axes have separate scales, so line heights do not compare equal dollar values. |
Outcome classifications follow the same assessment/recorded-status rules as Bidding – Sale Analysis. Awarded uses the application’s Won assumption; current status does not reconstruct historical government decisions.
Select periods and inspect the map
Drag a panel header onto another panel to swap their positions. For keyboard operation, focus the header and use the arrow keys. Layouts stay with the current browser session, and panels stack on smaller screens. Hover over chart observations for details; use chart zoom and legend controls where available.
Tables and CSV downloads appear below the chart workspace. Expand the relevant table to see its contents. The dashboard’s method and data-quality guide is at the bottom.
Click a Bid amounts or high-bid outcome observation to link the corresponding sale/date across the other bidding charts. A year point represents all its sales. The map highlights the selected sales’ complete usable bid-block footprint, regardless of the clicked company, rank scope or outcome. Oil/gas price observations do not select sales.
Chart selection preserves the map camera and does not automatically open an information window. Click a highlighted block to inspect selected-sale lease details, or a current lease for available lease information. The movable window does not change chart selections. Close keeps highlights; Clear selection clears charts, map and the window.
Selected blocks remain highlighted when zoomed out. At 1:300,000 or closer, labels show available recorded high bids, bidders and second bids. Map bid labels stay in recorded USD even when charts use GDP-adjusted dollars. Current leases are present-day context.
Export displayed and sale-level data
Expand the bid amounts/counts, rejection summaries and price tables below the workspace for CSV downloads. Downloads identify the displayed dollar basis; adjusted sale exports retain recorded amounts and adjustment factors. Maximum-value details retain the responsible blocks, including ties.
Rejection exports include totals, counts, averages, rates and reason summaries. Price exports identify the month, displayed commodity values and normalization basis. For raw individual bid assessments and company breakdowns, use Bidding – Sale Analysis for the chosen sale.
Interpret coverage and missing values
- Bid dollars represent submissions, including losses when All submitted bids is chosen, rather than actual payments.
- Company shares are recorded allocations; they are not normalized to 100% or consolidated for mergers. Invalid shares can leave company totals unknown while full-market bids remain usable.
- Years without usable recorded sales are omitted. Current-year results extend through today and are not assumed complete.
- Missing price months or unusable GDP factors remain gaps. An all-pending period has no defined rejection rate.
- Bid, rejection and price sources can fail independently. Other panels remain usable; review the source message and bottom method/data-quality guides, then click Analyze bidding to retry.
- Switching between the two Bidding dashboards retains their independent submitted results and display choices within the session.