

On December 20th, Lease Sale 261 was held in the Gulf of Mexico (view results here). Prior to the sale, forecasts were made by the GOM3 Bidding Analytics Addon, updated weekly as new data was released and integrated. Here we review how the forecasts fared for this sale.
262 deepwater blocks received bids in Sale 261, 205 of which occurred in the Bidding Model study area near existing leases. Forecasts were made on the probability each block would receive a bid, a forecasted high bid amount and our predicted MROV (minimum acceptable bid amount). Predictions are based on analysis of all lease sales over the last 15 years.
The likelihood of a block receiving a bid is grouped into five categories. The A category is composed of the 5% of blocks most likely to received a bid. The B category is composed of the next 10%, the C category the next 15%, the D category the next 20% and the E category the bottom 50%. This presents an easy way to view those most likely to receive bids. This graph shows the percentage within each group that received bids.
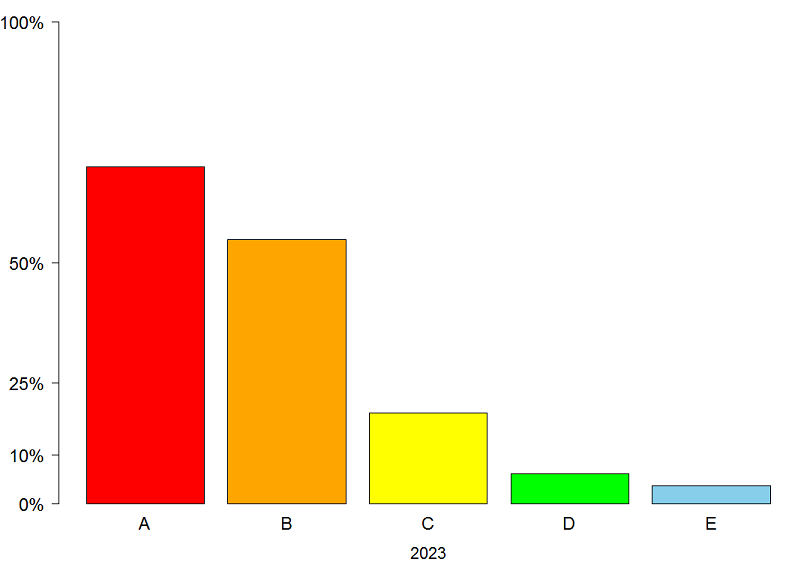 Percentage of each forecast category that received one or more bids.
In a set of 3,676 analyzed blocks, 10 appeared in the A category and 7 of those 10 received bids. Of the 3 that did not receive bids, 2 were added to list of available blocks in October, after the final notice of sale was re-issued. These two blocks around the Mudbug discovery were good candidates being in an active area with high previous bids and newly available, though it should be noted that other blocks added to the sale in October did receive bids.
It should be noted that the B category had an unusually high percentage receive bids in this sale. Some of those that received bids were actually in the A category when the final notice of sale was originally published in August, but slipped to the B category when other blocks were made available for bidding. All in all, the model matched expectations for identifying attractive targets.
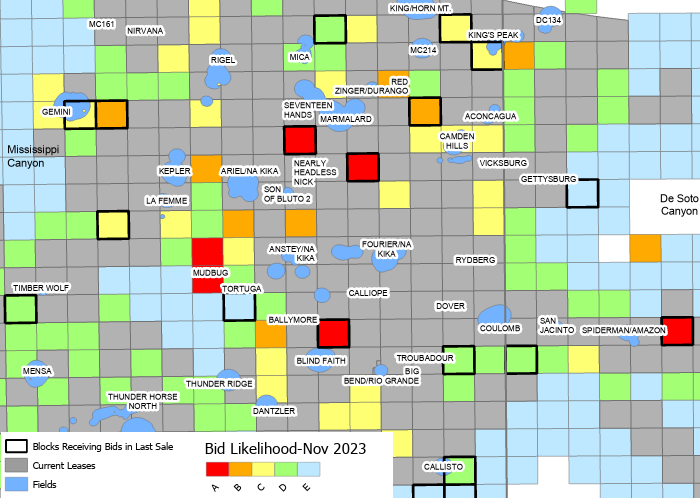 Likelihood of receiving at least one bid.
Zooming in on Mississippi Canyon 389 illustrates the accuracy and limitations in forecasting bid amounts. The block received five bids with the highest being Oxy's $25 million dollar bid (also the highest in the entire lease sale). Forecasting extremely high bids is difficult because of the distribution across so many forecasted blocks. But the forecasted amount of $1.98 million was just ahead of the runner-up, LLOG's $1.876 million.
Mississippi Canyon 389 Bids
The Bidding Model was updated this past fall after many discussions with users and initial results show improvement. Most of the changes, however, involve BOEM's bid/rejection forecasts so improvements there will be analyzed as acceptances come in over the next few months.
Finally, it's important to keep in mind that the GOM3 Bidding Analytics Addon is particularly helpful in reviewing the factors that are important to the most prolific bidders in recent history. This can be helpful not only in analyzing competitors in the future, but also to quickly see companies that may work well as partners. The graph below shows the analysis for one of the highly-active companies over the last decade (the company is omitted for this newsletter). The x-axis measures the positive or negative influence of a host of variables that provide explanatory power for which blocks this company is likely to bid.
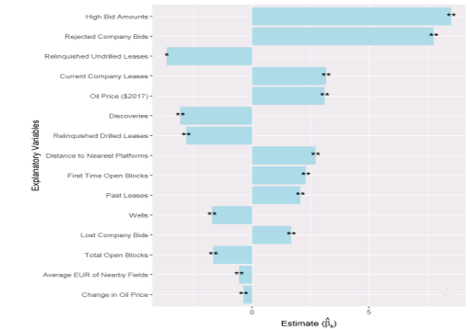 Tornado plot of most important factors influencing bidding for a single company.
To learn more about the Bidding model and other analytics from the GOM3 Analytics Addon, a number of helpful videos have been created and uploaded to this YouTube playlist. These videos are meant as both an introduction to the data and functionality within GOM3 but also as a deeper dive into some of the more advanced aspects of the statistical models and forecasts.